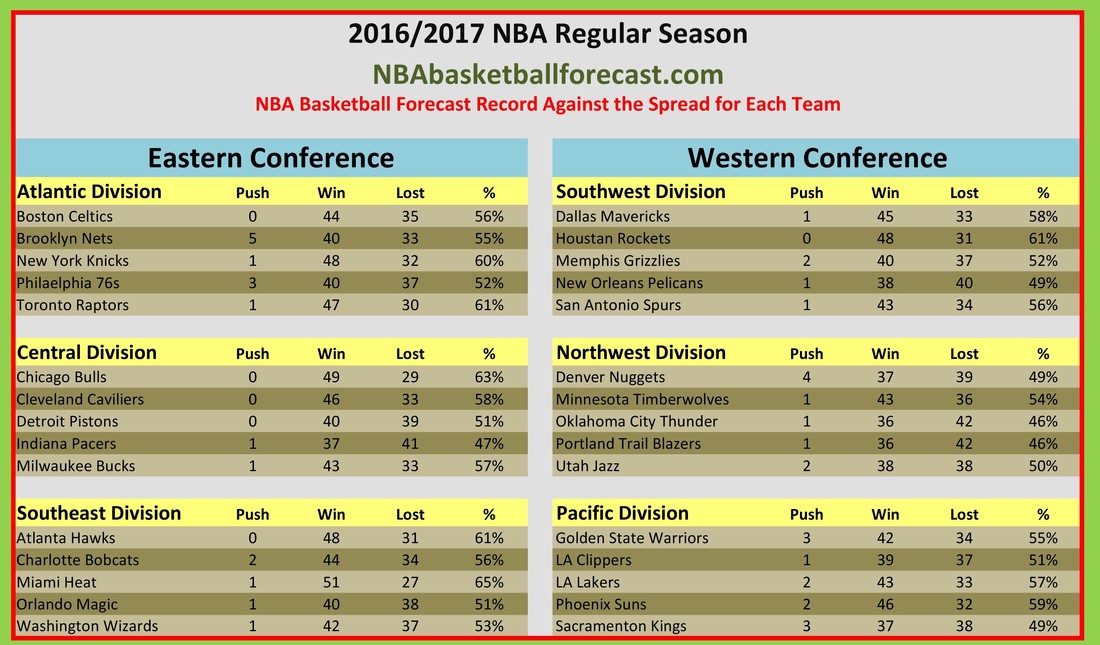
2016/2017 NBA Regular Season NBA Forecast Results against the spread
This is not the results of each team against the spread. It is the results of our picks against the spread. For example. We forecast 81 New York Knicks Games of those 81 games we won 48 times. Some of those wins we were forecasting the Knicks wouldn't cover and some were for the Knicks to cover. This will be useful in tuning up our forecasting methods that will be used next year because each team has their own style and strength. For example it gives us good indications as to weather a teams ability obtain the offensive rebound is being over emphasis or under emphasis in calculating how they will likely perform in their next game by isolating the teams with a high or low offensive rebound rate and verifying the winning percent. Modifications will then be made to those formulas to help improve the overall record that . With a sample feild of over 1,000 games this will help us get the formulas more tuned up for the 2017/2018 NBA season.
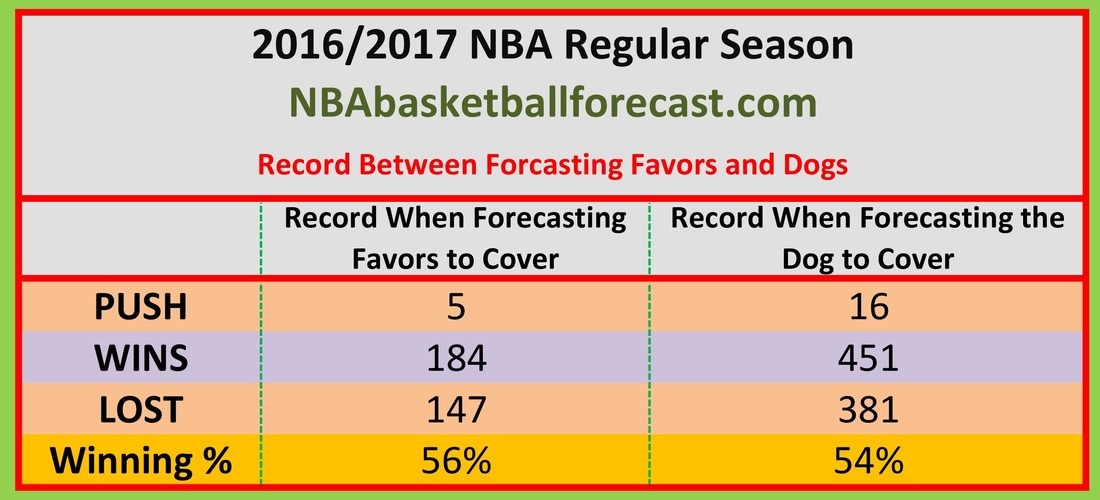
Forecast Record when selecting Favor and Dogs
Possibly a hair to aggressive on the dogs
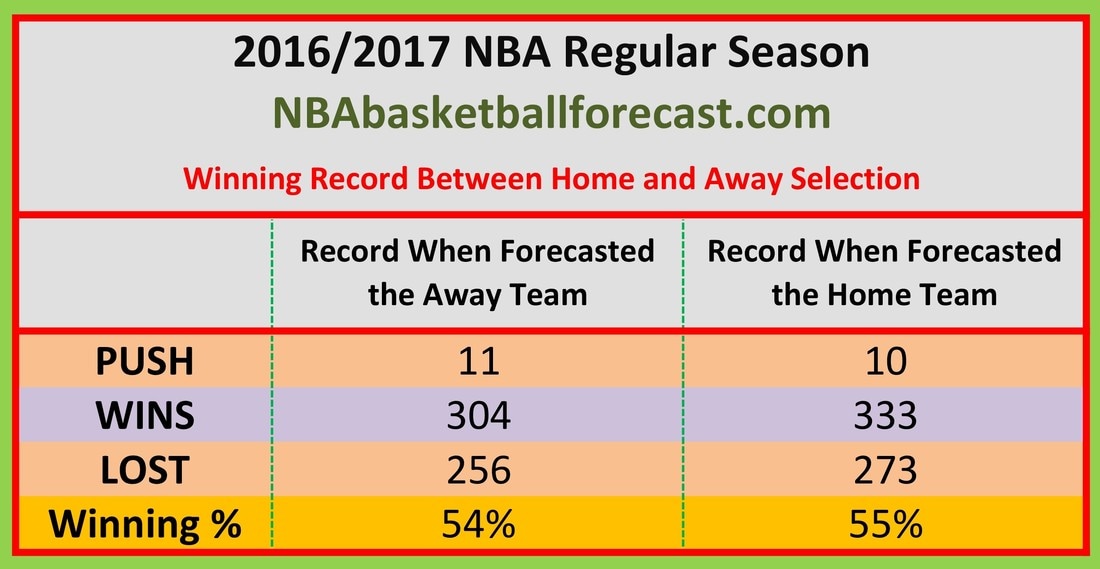
Forecast Record Compare to Spread when Selecting Home or Away Teams
Looking for out of balance selections to suggest where to target refinements to the Forecast calculations. Away and Home feel adjustments appear proper.
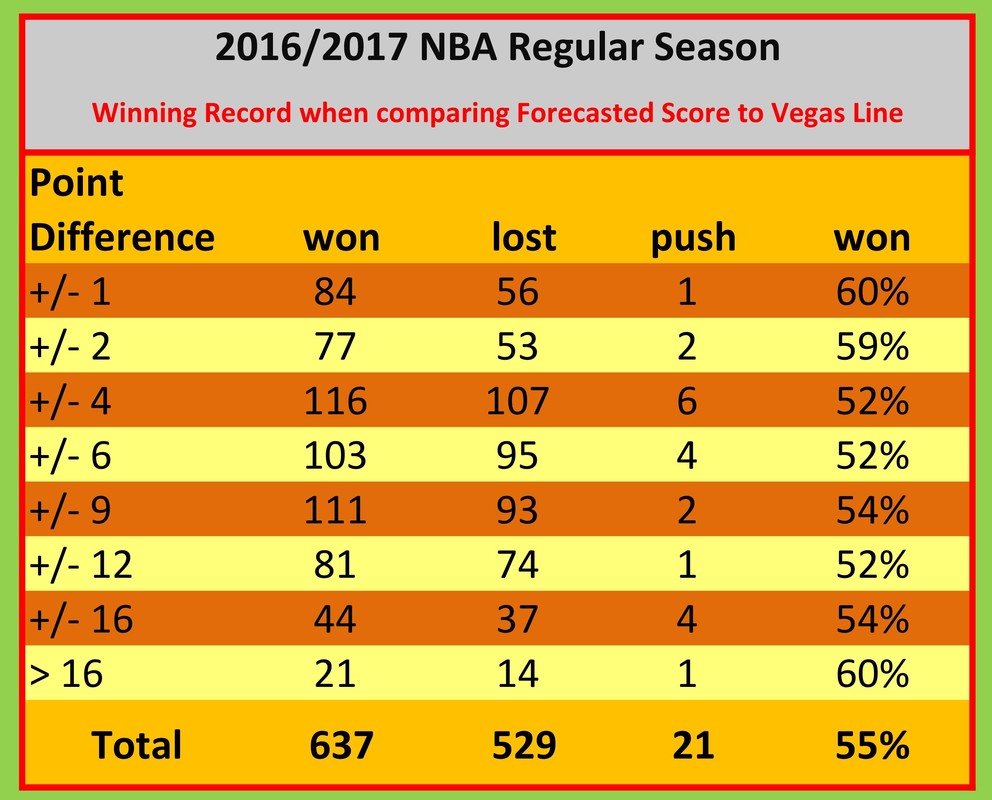
NBA Basketball Forecast record when comparing the forecast against the spread
The results on each line are for those who's spread fell on that line and up to the edge of the line above it.
If the Casino Line was -3 1/2 and we believe the dog was going to win by 7. The results of that would go on line +/- 12
If the Casino Line was -3 1/2 and we believe the favor was going to win by 7. The results of that would go on line +/- 4.
If the Casino Line was -3 1/2 and we believe the dog was going to win by 7. The results of that would go on line +/- 12
If the Casino Line was -3 1/2 and we believe the favor was going to win by 7. The results of that would go on line +/- 4.
The following is not the actual result of 2016/2017. We went back through 2016/2017 and modified our formulas. The below are the results following modifying the formulas. This should translate to improved results for 2017/2018.
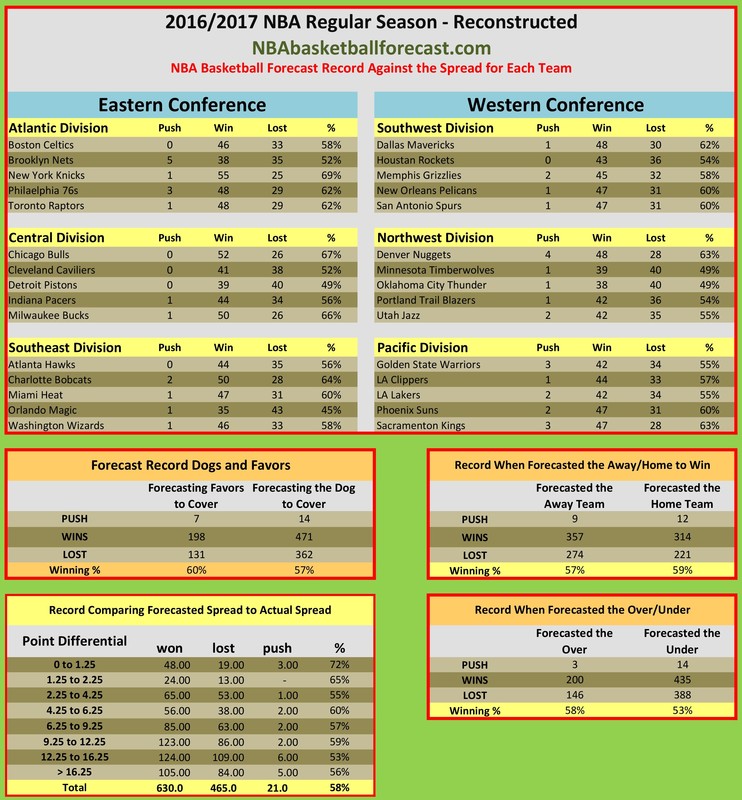
2016/2017 NBA Season Record